Gun violence and the prevalence of violent crime in the United States remain hot button issues in American society.
Undoubtedly, the US has remarkably high rates of violent crime compared to other developed nations in Europe and Asia, especially in certain regions, but what is the underlying cause behind these numbers? Could it be the nation’s lax gun laws and the ease of acquiring a firearm, or is there another explanation?
Is this about gun control or the lack thereof?
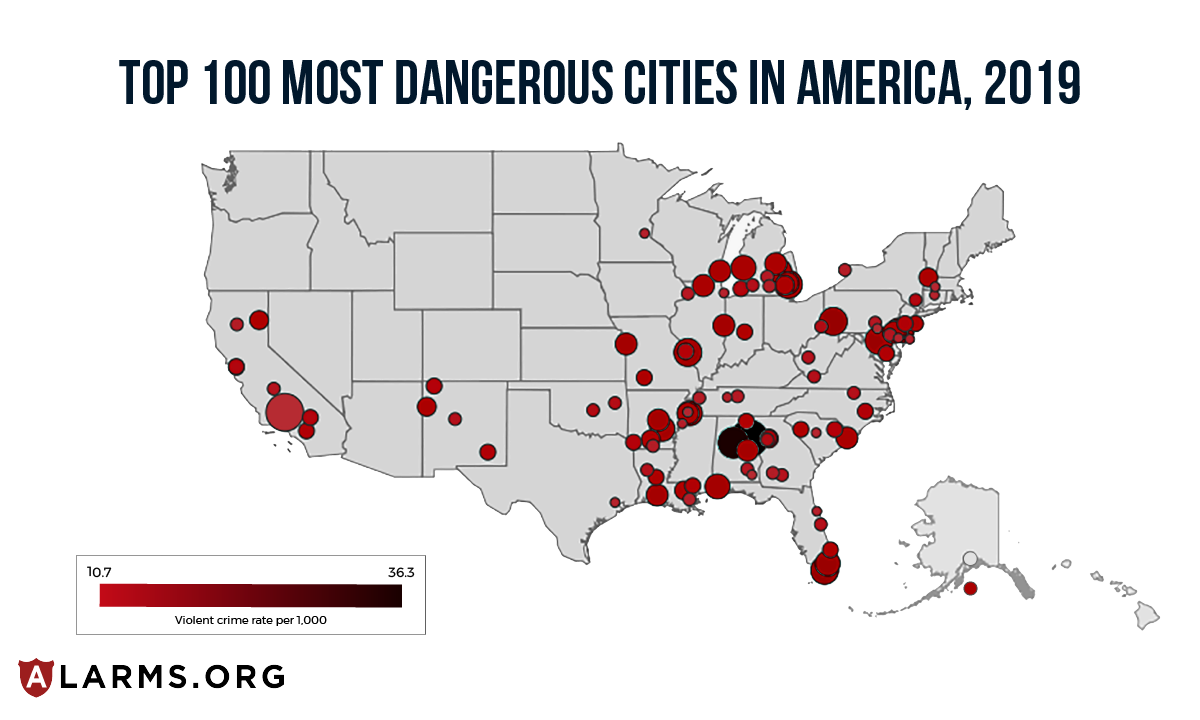
The strictness of gun laws seems to play a role in violent crime rates, as the states with well over their share of cities in the top 100 (Table 1), like Florida, Michigan, Georgia, and Alabama, all have rather lax gun laws. However, there are exceptions: New Jersey, home to five cities in the top 100, and Illinois, home to three (including #98 Chicago) have very strict gun laws.
Although mass shootings are becoming increasingly common in American life, the violent crime and prevalence of gun murders plaguing America’s most dangerous cities aren’t best explained by lax gun laws, rates of gun ownership, or one-off rampages (although, these do have an effect), but rather, by income inequality.
Where there is a high poverty rate, and little opportunity to earn a decent wage, we find high homicide rates and a prevalence of other types of violent crime.
The American communities suffering the hardest at the hands of violent crime are also some of the most impoverished in the country, with some of the highest unemployment rates, to boot.
Is this the most dangerous city in America?
Let’s look at the two communities that top the list: Anniston, AL (#1) and Bessemer, AL (#2) (see table 1 below). Both are small cities in Alabama that boasted bustling economies in decades past but have since fallen on hard times following the phenomenon of deindustrialization in the late 20th century.
Bessemer was once a hub of manufacturing and ore mining activity and home to a large Pullman Standard railroad car manufacturing factory, but as these industries dried up and/or moved elsewhere, unemployment rose, and with it, violent crime.
Now, Anniston and Bessemer are plagued by unemployment rates significantly higher than the national average, while the service industry jobs that have replaced manufacturing jobs in these communities often don’t come close to providing a decent living wage. The same phenomenon is seen all across the top 100: economic disenfranchisement leading to higher instances of violent crime.
Top 100 Most Dangerous Cities in America
Per violent crime rate average, per 1,000 people, police adequacy, population >= 10,000.| Rank | City | State | Violent crime rate per 1,000 |
|---|---|---|---|
| 1 | Anniston | Alabama | 34.34297427 |
| 2 | Bessemer | Alabama | 29.85584219 |
| 3 | Florida City | Florida | 22.75890299 |
| 4 | McKeesport | Pennsylvania | 21.25423891 |
| 5 | St. Louis | Missouri | 20.82285906 |
| 6 | Detroit | Michigan | 20.56673306 |
| 7 | Baltimore | Maryland | 20.27014907 |
| 8 | Memphis | Tennessee | 20.0332432 |
| 9 | Camden County | New Jersey | 19.67725003 |
| 10 | Opa Locka | Florida | 19.49844012 |
| 11 | Flint | Michigan | 19.45033901 |
| 12 | Pine Bluff | Arkansas | 18.47118959 |
| 13 | Prichard | Alabama | 18.26484018 |
| 14 | Muskegon Heights | Michigan | 18.07899128 |
| 15 | West Memphis | Arkansas | 17.7903367 |
| 16 | Danville | Illinois | 17.40627391 |
| 17 | Alexander City | Alabama | 17.29517092 |
| 18 | Kansas City | Missouri | 17.24308586 |
| 19 | Highland Park | Michigan | 17.01217812 |
| 20 | Crowley | Louisiana | 16.35191156 |
| 21 | Little Rock | Arkansas | 16.33603259 |
| 22 | Darby | Pennsylvania | 16.15326822 |
| 23 | Chester | Pennsylvania | 16.09580979 |
| 24 | Milwaukee | Wisconsin | 15.97364106 |
| 25 | Wilmington | Delaware | 15.96042039 |
| 26 | Rockford | Illinois | 15.88199223 |
| 27 | Myrtle Beach | South Carolina | 15.76868574 |
| 28 | Saginaw | Michigan | 15.6825619 |
| 29 | Gallup | New Mexico | 15.4284462 |
| 30 | Camden | Arkansas | 14.99683802 |
| 31 | North Adams | Massachusetts | 14.90577695 |
| 32 | Hammond | Louisiana | 14.87060641 |
| 33 | College Park | Georgia | 14.66895731 |
| 34 | Inkster | Michigan | 14.55352738 |
| 35 | Susanville | California | 14.49979187 |
| 36 | Alexandria | Louisiana | 14.41704973 |
| 37 | Riviera Beach | Florida | 13.6958536 |
| 38 | Asbury Park | New Jersey | 13.60500766 |
| 39 | Greenwood | South Carolina | 13.54537271 |
| 40 | Springfield | Missouri | 13.38835723 |
| 41 | Indianapolis | Indiana | 13.3396418 |
| 42 | Scottsboro | Alabama | 13.09686221 |
| 43 | East Point | Georgia | 13.06659205 |
| 44 | Oakland | California | 12.99318687 |
| 45 | Cambridge | Maryland | 12.99013712 |
| 46 | Bogalusa | Louisiana | 12.97935103 |
| 47 | San Bernardino | California | 12.91085755 |
| 48 | Trenton | New Jersey | 12.85749902 |
| 49 | Artesia | New Mexico | 12.83500161 |
| 50 | Kinston | North Carolina | 12.7939974 |
| 51 | Vinita Park | Missouri | 12.74749119 |
| 52 | Farmington | New Mexico | 12.67708842 |
| 53 | Florence | South Carolina | 12.66612916 |
| 54 | Texarkana | Texas | 12.61812998 |
| 55 | Emeryville | California | 12.61381672 |
| 56 | Barstow | California | 12.56866989 |
| 57 | Benton Township | Michigan | 12.54005852 |
| 58 | Newburgh | New York | 12.35754986 |
| 59 | Union City | Georgia | 12.24007561 |
| 60 | Shawnee | Oklahoma | 12.23010244 |
| 61 | Wheeling | West Virginia | 12.2076776 |
| 62 | Muskogee | Oklahoma | 12.06837875 |
| 63 | Anchorage | Alaska | 12.03289802 |
| 64 | Henderson | North Carolina | 12.0282863 |
| 65 | Cocoa | Florida | 11.99014509 |
| 66 | Kalamazoo | Michigan | 11.97172941 |
| 67 | Bluefield | West Virginia | 11.92353173 |
| 68 | Los Lunas | New Mexico | 11.91472918 |
| 69 | Natchitoches | Louisiana | 11.86830015 |
| 70 | Tifton | Georgia | 11.76957653 |
| 71 | Selma | California | 11.76612806 |
| 72 | Charleston | West Virginia | 11.72419447 |
| 73 | Elkton | Maryland | 11.64999367 |
| 74 | Harrisburg | Pennsylvania | 11.5564298 |
| 75 | Clinton | Iowa | 11.55412815 |
| 76 | Troy | Alabama | 11.46694215 |
| 77 | Nashville Metropolitan | Tennessee | 11.38171873 |
| 78 | Lansing | Michigan | 11.35836013 |
| 79 | Jackson | Michigan | 11.30339406 |
| 80 | Albany | Georgia | 11.2964253 |
| 81 | Red Bluff | California | 11.29225775 |
| 82 | El Dorado | Arkansas | 11.28334338 |
| 83 | Dyersburg | Tennessee | 11.25692271 |
| 84 | Niagara Falls | New York | 11.24315387 |
| 85 | New Orleans | Louisiana | 11.21407383 |
| 86 | Dickson | Tennessee | 11.191405 |
| 87 | Helena-West Helena | Arkansas | 11.12263173 |
| 88 | Daytona Beach | Florida | 11.07098455 |
| 89 | Minneapolis | Minnesota | 11.01269539 |
| 90 | Atlantic City | New Jersey | 11.01007746 |
| 91 | Chicago | Illinois | 10.98858867 |
| 92 | Houston | Texas | 10.95227811 |
| 93 | Hartford | Connecticut | 10.92838369 |
| 94 | Bridgeton | New Jersey | 10.90748687 |
| 95 | Holyoke | Massachusetts | 10.82791526 |
| 96 | West Columbia | South Carolina | 10.77559966 |
| 97 | Marion | Arkansas | 10.76400129 |
| 98 | York | Pennsylvania | 10.76225004 |
| 99 | Ozark | Alabama | 10.71502164 |
| 100 | Arvin | California | 10.70593735 |
Is this the other most dangerous city in America?
Next, we wanted to look at the most dangerous large cities in the United States, so we excluded all communities with a population less than 100,000. Rather than just consider the violent crime rates of these cities, we also factored in a “police adequacy” score, which is the total number of crimes divided by the number of police officers servicing the city.
Employing these calculations yields some surprising results, with few of the usual suspects like Detroit, Chicago, or Baltimore appearing on the list. Instead, mid-sized cities in the Pacific Northwest and California dominate the ranking.
Four Washington cities appear in the top ten, as well as Billings, Montana (#3) and Portland, Oregon (#9), also in the region. These results tell a different story than what you usually encounter when hearing about the crime problem in America, but the issue is complex and multi-faceted.
California cities, located all over the state, account for a whopping 28 positions on the list. This may indicate that the overburdened police forces in these cities encounter a higher amount of crime than they are capable of policing.

Top 100 Most Dangerous Large Cities in America
Per violent crime rate average, police adequacy, population >= 100,000). The Crime Score is the index that combines Normalized crime rate and Police adequacy.| Rank | City | State | Crime Score |
|---|---|---|---|
| 1 | Springfield | Missouri | 0.767828695 |
| 2 | Spokane | Washington | 0.749935645 |
| 3 | Billings | Montana | 0.723097584 |
| 4 | Tacoma | Washington | 0.719377157 |
| 5 | Vallejo | California | 0.716943948 |
| 6 | Anchorage | Alaska | 0.71605993 |
| 7 | Kent | Washington | 0.713783156 |
| 8 | Renton | Washington | 0.708033763 |
| 9 | Portland | Oregon | 0.704302058 |
| 10 | Davenport | Iowa | 0.699437336 |
| 11 | Pueblo | Colorado | 0.698556722 |
| 12 | Modesto | California | 0.697833363 |
| 13 | Wichita | Kansas | 0.692869094 |
| 14 | Bakersfield | California | 0.692015163 |
| 15 | Oakland | California | 0.689643814 |
| 16 | Antioch | California | 0.68875917 |
| 17 | Little Rock | Arkansas | 0.681923575 |
| 18 | San Bernardino | California | 0.676706846 |
| 19 | Tulsa | Oklahoma | 0.671136415 |
| 20 | San Antonio | Texas | 0.67055464 |
| 21 | Independence | Missouri | 0.670155923 |
| 22 | Indianapolis | Indiana | 0.665182981 |
| 23 | Tucson | Arizona | 0.665032295 |
| 24 | Pompano Beach | Florida | 0.658606708 |
| 25 | Berkeley | California | 0.657702607 |
| 26 | Salinas | California | 0.651501527 |
| 27 | Springfield | Illinois | 0.649348064 |
| 28 | Knoxville | Tennessee | 0.646383035 |
| 29 | Tallahassee | Florida | 0.642456176 |
| 30 | Gresham | Oregon | 0.64214641 |
| 31 | Memphis | Tennessee | 0.641475949 |
| 32 | Costa Mesa | California | 0.637844128 |
| 33 | Chattanooga | Tennessee | 0.637024782 |
| 34 | Des Moines | Iowa | 0.636767618 |
| 35 | Rockford | Illinois | 0.635939716 |
| 36 | Minneapolis | Minnesota | 0.635281367 |
| 37 | Everett | Washington | 0.635181968 |
| 38 | Reno | Nevada | 0.629239442 |
| 39 | San Angelo | Texas | 0.628679898 |
| 40 | Evansville | Indiana | 0.625795148 |
| 41 | Salem | Oregon | 0.624793832 |
| 42 | Corpus Christi | Texas | 0.624727343 |
| 43 | Vancouver | Washington | 0.62453566 |
| 44 | Concord | California | 0.624019624 |
| 45 | Topeka | Kansas | 0.623881265 |
| 46 | Lansing | Michigan | 0.623609756 |
| 47 | Glendale | Arizona | 0.62339135 |
| 48 | Riverside | California | 0.62212986 |
| 49 | South Bend | Indiana | 0.621115942 |
| 50 | Visalia | California | 0.620685965 |
| 51 | Seattle | Washington | 0.620594675 |
| 52 | Lexington | Kentucky | 0.619363312 |
| 53 | Ventura | California | 0.619155861 |
| 54 | Shreveport | LOUISIANA | 0.619018506 |
| 55 | San Francisco | California | 0.618273556 |
| 56 | Downey | California | 0.617460457 |
| 57 | Columbia | South Carolina | 0.616862623 |
| 58 | Eugene | Oregon | 0.616589458 |
| 59 | Fresno | California | 0.613930678 |
| 60 | Fairfield | California | 0.613606951 |
| 61 | Oklahoma City | Oklahoma | 0.612745356 |
| 62 | Richmond | California | 0.610352007 |
| 63 | Fargo | North Dakota | 0.610216662 |
| 64 | Columbia | Missouri | 0.609009309 |
| 65 | Omaha | Nebraska | 0.608657591 |
| 66 | Akron | Ohio | 0.608104577 |
| 67 | Garden Grove | California | 0.606799743 |
| 68 | Lafayette | Louisiana | 0.606205028 |
| 69 | Beaumont | Texas | 0.605977283 |
| 70 | San Jose | California | 0.604272725 |
| 71 | Lakewood | Colorado | 0.603591415 |
| 72 | Pomona | California | 0.601949764 |
| 73 | Orlando | Florida | 0.599773336 |
| 74 | Baton Rouge | Louisiana | 0.599042753 |
| 75 | Houston | Texas | 0.598831586 |
| 76 | Nashville Metropolitan | Tennessee | 0.59857062 |
| 77 | Columbus | Ohio | 0.598403581 |
| 78 | North Las Vegas | Nevada | 0.594745768 |
| 79 | Sioux Falls | South Dakota | 0.59154341 |
| 80 | North Charleston | South Carolina | 0.591217643 |
| 81 | Phoenix | Arizona | 0.590746813 |
| 82 | Bellevue | Washington | 0.590351364 |
| 83 | Odessa | Texas | 0.590175915 |
| 84 | Sacramento | California | 0.589574585 |
| 85 | Cedar Rapids | Iowa | 0.588804593 |
| 86 | Mesquite | Texas | 0.58735419 |
| 87 | Fullerton | California | 0.587003723 |
| 88 | El Monte | California | 0.586904977 |
| 89 | Durham | North Carolina | 0.584999156 |
| 90 | West Covina | California | 0.584781091 |
| 91 | Kansas City | Missouri | 0.582779907 |
| 92 | Fremont | California | 0.582169827 |
| 93 | St. Louis | Missouri | 0.581853251 |
| 94 | West Palm Beach | Florida | 0.580614947 |
| 95 | Murfreesboro | Tennessee | 0.579415288 |
| 96 | St. Petersburg | Florida | 0.578016539 |
| 97 | Hayward | California | 0.577819761 |
| 98 | Fort Lauderdale | Florida | 0.577815484 |
| 99 | Clovis | California | 0.576053487 |
| 100 | Miami Gardens | Florida | 0.575906515 |
Does population size matter when ranking America’s dangerous cities?
Many of the communities in Table 1 are relatively small, with most having populations hovering in between 10K and 30K. In smaller cities, it only takes a few violent crimes to lend a significant boost to the crime rate.
However, many of these communities are adjacent to larger metropolitan areas, such as #4 McKeesport, PA (population: 19,731), which is part of the Pittsburgh metropolitan area, and Florida City, FL falling just outside of the Miami border.
Many of these smaller communities have violent crime rates similar to the most dangerous neighborhoods of the larger cities they are adjacent to, and in many cases, they border these neighborhoods. The difference is that the larger cities also have more affluent, low crime areas that lower their overall violent crime rates, while their smaller satellite cities do not.
Looking at the cities with the highest increase in violent crime (Table 3), we do not find booming megalopolises, but rather smaller communities just breaking the population threshold.
In essence, it is the smaller cities that actually may have the greatest ongoing risk of violent crime. Baton Rouge, LA (#16), Louisiana’s capital city, is the outlier here, with a population of 227,715.

Cities with the highest increase in violent crime
Population >= 10,000. The crime rate in 2017 minus the crime rate in 2016. If it is positive, that means the crime rate went up; in some cities, the crime rate increased more than other cities; the rank captures which cities have the highest increase in crime rates.| Rank | City | State | Change in crime rate ranking, per 1,000 |
|---|---|---|---|
| 1 | Fairfield | Alabama | 35.38883343 |
| 2 | Emeryville | California | 33.05277001 |
| 3 | Crowley | Louisiana | 27.23889588 |
| 4 | Mayfield | Kentucky | 22.75296825 |
| 5 | Magnolia | Arkansas | 22.36848483 |
| 6 | Cambridge | Maryland | 20.70533436 |
| 7 | Lebanon | Missouri | 17.52995153 |
| 8 | Riverdale | Georgia | 16.62145704 |
| 9 | Zachary | Louisiana | 15.3129598 |
| 10 | Millington | Tennessee | 14.94921909 |
| 11 | Muskegon | Michigan | 14.33314302 |
| 12 | Keokuk | Iowa | 14.03528729 |
| 13 | Goodlettsville | Tennessee | 13.89001197 |
| 14 | East Point | Georgia | 13.81823237 |
| 15 | Bemidji | Minnesota | 13.81798387 |
| 16 | Baton Rouge | Louisiana | 13.3293702 |
| 17 | Fox Lake | Illiinois | 12.64958372 |
| 18 | Arkansas City | Kansas | 12.58435569 |
| 19 | Douglas | Arizona | 12.44601565 |
| 20 | Elizabethton | Tennessee | 12.34136734 |
| 21 | Tifton | Georgia | 12.23844069 |
| 22 | Beverly Hills | California | 12.22796402 |
| 23 | Rogers | Minnesota | 12.15972878 |
| 24 | Granite City | Illinois | 11.75244136 |
| 25 | Homewood | Illinois | 11.549497 |
| 26 | Saraland | Alabama | 11.41931744 |
| 27 | Payson | Arizona | 11.33090935 |
| 28 | Greer | South Carolina | 11.22596116 |
| 29 | Miami | Oklahoma | 11.20960594 |
| 30 | El Cerrito | California | 11.08965644 |
| 31 | Ottumwa | Iowa | 11.02552662 |
| 32 | Pineville | Louisiana | 10.65711463 |
| 33 | Vincennes | Indiana | 10.44070001 |
| 34 | Belmont | North Carolina | 10.40007691 |
| 35 | Merriam | Kansas | 10.21047565 |
| 36 | Edgewater | Florida | 10.13043236 |
| 37 | Farmington | New Mexico | 9.957216669 |
| 38 | Grandview | Missouri | 9.48763306 |
| 39 | Panama City | Florida | 9.269999124 |
| 40 | Radcliff | Kentucky | 9.259549659 |
| 41 | Leesburg | Florida | 9.156046349 |
| 42 | East Windsor | Connecticut | 9.146695949 |
| 43 | Bristol | Virginia | 8.939233903 |
| 44 | Haysville | Kansas | 8.863271823 |
| 45 | Auburn | Alabama | 8.837354901 |
| 46 | Bessemer | Alabama | 8.710984079 |
| 47 | Windsor | Connecticut | 8.676499193 |
| 48 | East Grand Rapids | Michigan | 8.534606586 |
| 49 | Memphis | Tennessee | 8.464779678 |
| 50 | Gautier | Mississippi | 8.288952318 |
| 51 | Bardstown | Kentucky | 8.17814829 |
| 52 | Gadsden | Alabama | 8.152763436 |
| 53 | St. Joseph | Missouri | 8.101308308 |
| 54 | Billings | Montana | 8.100145482 |
| 55 | Highland Park | Michigan | 8.032202768 |
| 56 | Taylorville | Illinois | 7.934669931 |
| 57 | Muskogee | Oklahoma | 7.921678948 |
| 58 | Moberly | Missouri | 7.849337815 |
| 59 | Camden | Arkansas | 7.830855782 |
| 60 | Stoughton | Wisconsin | 7.80256563 |
| 61 | Sauk Village | Illinois | 7.790122704 |
| 62 | Kingsport | Tennessee | 7.734682666 |
| 63 | Stafford | Texas | 7.724299849 |
| 64 | Prichard | Alabama | 7.684063929 |
| 65 | Albuquerque | New Mexico | 7.620129131 |
| 66 | Defiance | Ohio | 7.608639921 |
| 67 | Opelousas | Louisiana | 7.576058658 |
| 68 | Florence | Alabama | 7.489299399 |
| 69 | Freeport | Illinois | 7.470669392 |
| 70 | Thomasville | North Carolina | 7.388543725 |
| 71 | Woodburn | Oregon | 7.382296576 |
| 72 | San Francisco | California | 7.311918657 |
| 73 | Ceres | California | 7.291313494 |
| 74 | Maple Shade Township | New Jersey | 7.099280956 |
| 75 | Clinton | Iowa | 7.091208252 |
| 76 | Central Marin | California | 7.07456679 |
| 77 | Albany | Georgia | 7.072364085 |
| 78 | Sturgis | Michigan | 6.952466936 |
| 79 | Great Bend | Kansas | 6.890857406 |
| 80 | Fairfield Township | Ohio | 6.882081328 |
| 81 | Santa Clara | California | 6.851820127 |
| 82 | Valdosta | Georgia | 6.847283559 |
| 83 | South Miami | Florida | 6.837884554 |
| 84 | Cordele | Georgia | 6.829704174 |
| 85 | Kings Mountain | North Carolina | 6.824478031 |
| 86 | Andover | Kansas | 6.814508469 |
| 87 | Swatara Township | Pennsylvania | 6.752305311 |
| 88 | Lakewood | Ohio | 6.733518079 |
| 89 | Oxford | Alabama | 6.652529805 |
| 90 | Southern Regional York County | Pennsylvania | 6.647038624 |
| 91 | Greenbelt | Maryland | 6.63829943 |
| 92 | Pleasant Hill | California | 6.636523124 |
| 93 | Santa Monica | California | 6.589431382 |
| 94 | Plainville | Connecticut | 6.582761895 |
| 95 | Lincolnwood | Illinois | 6.571616234 |
| 96 | Ozark | Missouri | 6.541356323 |
| 97 | Streetsboro | Ohio | 6.429699322 |
| 98 | Muskegon Heights | Michigan | 6.390527875 |
| 99 | Fitchburg | Wisconsin | 6.382372035 |
| 100 | Bryant | Arkansas | 6.322247118 |
Is violent crime decreasing in America?
Despite the high violent crime rates plaguing these cities, there is evidence that, overall, the violence is lessening, and will continue to do so.
Nationwide, the violent crime rate fell 0.9%, overall, despite rises in the cities found in Table 4. Most American communities experienced a net decrease in murder rate and violent crime.
While the trend of declining violent crime across the board offers up some hope for American cities besieged by violence and murder, many of them have deep-seated issues that have plagued their neighborhoods for decades, and it is not entirely clear where the solution lies.
In addition, even if ranked among the “worst” trends for larger cities, many of these cities still have negative crime trending (reduced violent crime over time). The “surprise” is that cities of such size make up a minority of the 100 cities with high violent crime rates. This may be an artifact of our information system. More attention is paid to the events of a large city from outside that city. Small cities’ events tend to not be propagated as far in the media.

Large cities with the highest increase in violent crime
Population >= 100,000. The crime rate in 2017 minus the crime rate in 2016. If it is positive, that means the crime rate went up; in some cities, the crime rate increased more than other cities; the rank captures which cities have the highest increase in crime rates.| Rank | City | State | Change in crime rate ranking, per 1,000 |
|---|---|---|---|
| 1 | Baton Rouge | Louisiana | 13.3293702 |
| 2 | Memphis | Tennessee | 8.464779678 |
| 3 | Billings | Montana | 8.100145482 |
| 4 | Albuquerque | New Mexico | 7.620129131 |
| 5 | San Francisco | California | 7.311918657 |
| 6 | Santa Clara | California | 6.851820127 |
| 7 | Anchorage | Alaska | 5.772541404 |
| 8 | Portland | Oregon | 5.474339463 |
| 9 | Chattanooga | Tennessee | 5.43792489 |
| 10 | Berkeley | California | 5.397739354 |
| 11 | Gresham | Oregon | 5.152564725 |
| 12 | Minneapolis | Minnesota | 4.118798448 |
| 13 | Baltimore | Maryland | 3.965880132 |
| 14 | Springfield | Missouri | 3.877629251 |
| 15 | New Orleans | Louisiana | 3.754146612 |
| 16 | Peoria | Illinois | 3.64768966 |
| 17 | Fairfield | California | 3.637668526 |
| 18 | Clarksville | Tennessee | 3.619785695 |
| 19 | Sunnyvale | California | 3.575459923 |
| 20 | St. Paul | Minnesota | 3.398781043 |
| 21 | Columbia | Missouri | 3.264835266 |
| 22 | Elizabeth | New Jersey | 3.204308289 |
| 23 | Independence | Missouri | 3.200892272 |
| 24 | Richmond | California | 3.075459114 |
| 25 | Salem | Oregon | 3.007235654 |
| 26 | El Monte | California | 2.99396657 |
| 27 | Bridgeport | Connecticut | 2.868308866 |
| 28 | St. Louis | Missouri | 2.795029948 |
| 29 | Springfield | Illinois | 2.692224788 |
| 30 | Inglewood | California | 2.66757046 |
| 31 | Kansas City | Missouri | 2.565637555 |
| 32 | Davenport | Iowa | 2.436057637 |
| 33 | Palm Bay | Florida | 2.434437856 |
| 34 | North Las Vegas | Nevada | 2.345587969 |
| 35 | Fullerton | California | 2.218249148 |
| 36 | Oakland | California | 2.207173198 |
| 37 | Simi Valley | California | 2.182940304 |
| 38 | Overland Park | Kansas | 2.13822742 |
| 39 | Omaha | Nebraska | 1.932003381 |
| 40 | Miami Gardens | Florida | 1.904804781 |
| 41 | Hayward | California | 1.885473269 |
| 42 | Des Moines | Iowa | 1.765402456 |
| 43 | Coral Springs | Florida | 1.748503884 |
| 44 | Santa Rosa | California | 1.697980304 |
| 45 | Evansville | Indiana | 1.59796126 |
| 46 | Nashville Metropolitan | Tennessee | 1.571584488 |
| 47 | Fremont | California | 1.558579322 |
| 48 | High Point | North Carolina | 1.545060145 |
| 49 | Jersey City | New Jersey | 1.5290249 |
| 50 | Murfreesboro | Tennessee | 1.383229336 |
| 51 | Lansing | Michigan | 1.36991868 |
| 52 | Little Rock | Arkansas | 1.363035069 |
| 53 | Allen | Texas | 1.334373065 |
| 54 | Killeen | Texas | 1.323352716 |
| 55 | Edison Township | New Jersey | 1.26357433 |
| 56 | Rancho Cucamonga | California | 1.24894425 |
| 57 | Shreveport | Louisiana | 1.232750698 |
| 58 | Wichita | Kansas | 1.192280684 |
| 59 | Naperville | Illinois | 1.179864909 |
| 60 | Newark | New Jersey | 1.132814758 |
| 61 | Visalia | California | 1.081318319 |
| 62 | Los Angeles | California | 1.043436167 |
| 63 | Syracuse | New York | 1.020376571 |
| 64 | Boise | Idaho | 1.004629332 |
| 65 | Fort Collins | Colorado | 0.967734167 |
| 66 | San Jose | California | 0.957661497 |
| 67 | Denver | Colorado | 0.956025992 |
| 68 | Rochester | New York | 0.946634094 |
| 69 | Paterson | New Jersey | 0.911694206 |
| 70 | Burbank | California | 0.88490611 |
| 71 | Concord | California | 0.779714249 |
| 72 | Gilbert | Arizona | 0.770535339 |
| 73 | Santa Clarita | California | 0.677310872 |
| 74 | Phoenix | Arizona | 0.668646766 |
| 75 | Chicago | Illinois | 0.661658205 |
| 76 | Chandler | Arizona | 0.65783521 |
| 77 | Moreno Valley | California | 0.639198436 |
| 78 | Garden Grove | California | 0.593275228 |
| 79 | Salinas | California | 0.530985122 |
| 80 | Pompano Beach | Florida | 0.527632424 |
| 81 | North Charleston | South Carolina | 0.474461909 |
| 82 | Denton | Texas | 0.460258619 |
| 83 | Carlsbad | California | 0.456597533 |
| 84 | Frisco | Texas | 0.440899911 |
| 85 | Grand Prairie | Texas | 0.43949332 |
| 86 | Cary | North Carolina | 0.427698793 |
| 87 | Hillsboro | Oregon | 0.352389429 |
| 88 | Norwalk | California | 0.348587685 |
| 89 | McKinney | Texas | 0.336967231 |
| 90 | Santa Ana | California | 0.324093576 |
| 91 | Broken Arrow | Oklahoma | 0.27805118 |
| 92 | Aurora | Colorado | 0.23286123 |
| 93 | Torrance | California | 0.211859723 |
| 94 | Ann Arbor | Michigan | 0.175472406 |
| 95 | Thousand Oaks | California | 0.137212449 |
| 96 | El Paso | Texas | 0.092558492 |
| 97 | Beaumont | Texas | 0.039400182 |
| 98 | Elgin | Illinois | 0.034571671 |
| 99 | San Mateo | California | 0.032842541 |
| 100 | Newport News | Virginia | 0.031950818 |
Another way to rank America’s most dangerous cities?
Table 5 is an interesting way to look at cities with violent crime issues from a different perspective, by averaging a city’s violent crime rate with its increase in violent crime over the last year of available data. This allows us to examine cities with already serious crime issues while taking stock of their potential for further crime increases in the future.
On this list, we find Memphis, Tennessee (#1), Baltimore, Maryland (#3), and St. Louis, Missouri (#6), mid-sized cities plagued perennially with gun murders and other violent crime.
However, there are some surprises, as well, including Baton Rouge, Louisiana (#10), Anchorage, Alaska (#4) and Minneapolis, Minnesota (#8). These cities aren’t the first to be mentioned when discussing American cities with severe crime issues, but are brought up in the ranking by their significant increases in violent crime in the past year, and may get more national attention in coming years.

Large cities averaged violent crime rate with increase in violent crime
Population over 100,000. We created a ranking based on Change in crime rate between 2016 and 2017. Then we created a ranking based on Violent crime rate 2017. We averaged the two ranks. The final ranking that combines the worst violent crime worst increase in overall crime rate is shown in the last column. Some cities are tied because of the same average of two ranks.| Rank | City | State | Change in crime rate rank | Violent crime rate rank | Averaged violent crime rate with increase in violent crime rate |
|---|---|---|---|---|---|
| 1 | Memphis | Tennessee | 2 | 4 | 3 |
| 2 | Albuquerque | New Mexico | 4 | 10 | 7 |
| 3 | Baltimore | Maryland | 13 | 3 | 8 |
| 4 | Anchorage | Alaska | 7 | 15 | 11 |
| 5 | Springfield | Missouri | 14 | 11 | 12.5 |
| 6 | Baton Rouge | Louisiana | 1 | 28 | 14.5 |
| 6 | St. Louis | Missouri | 28 | 1 | 14.5 |
| 8 | Minneapolis | Minnesota | 12 | 19 | 15.5 |
| 9 | Chattanooga | Tennessee | 9 | 23 | 16 |
| 10 | New Orleans | Louisiana | 15 | 18 | 16.5 |
| 11 | Kansas City | Missouri | 31 | 5 | 18 |
| 12 | Oakland | California | 36 | 13 | 24.5 |
| 13 | Springfield | Illinois | 29 | 25 | 27 |
| 14 | Little Rock | Arkansas | 52 | 6 | 29 |
| 15 | Nashville Metropolitan | Tennessee | 46 | 16 | 31 |
| 16 | Richmond | California | 24 | 39 | 31.5 |
| 17 | North Las Vegas | Nevada | 34 | 31 | 32.5 |
| 18 | Bridgeport | Connecticut | 27 | 41 | 34 |
| 18 | Lansing | Michigan | 51 | 17 | 34 |
| 20 | San Francisco | California | 5 | 70 | 37.5 |
| 20 | Elizabeth | New Jersey | 22 | 53 | 37.5 |
| 22 | Peoria | Illinois | 16 | 61 | 38.5 |
| 23 | Wichita | Kansas | 58 | 29 | 43.5 |
| 24 | Shreveport | Louisiana | 57 | 33 | 45 |
| 25 | Miami Gardens | Florida | 40 | 55 | 47.5 |
| 25 | Chicago | Illinois | 75 | 20 | 47.5 |
| 27 | Davenport | Iowa | 32 | 66 | 49 |
| 28 | Inglewood | California | 30 | 72 | 51 |
| 29 | Newark | New Jersey | 60 | 43 | 51.5 |
| 30 | Rochester | New York | 68 | 42 | 55 |
| 31 | Killeen | Texas | 54 | 58 | 56 |
| 32 | St. Paul | Minnesota | 20 | 93 | 56.5 |
| 33 | Clarksville | Tennessee | 18 | 101 | 59.5 |
| 33 | North Charleston | South Carolina | 81 | 38 | 59.5 |
| 35 | Los Angeles | California | 62 | 59 | 60.5 |
| 35 | Beaumont | Texas | 97 | 24 | 60.5 |
| 37 | Berkeley | California | 10 | 112 | 61 |
| 38 | Portland | Oregon | 8 | 118 | 63 |
| 38 | Evansville | Indiana | 45 | 81 | 63 |
| 40 | Pompano Beach | Florida | 80 | 47 | 63.5 |
| 41 | Des Moines | Iowa | 42 | 87 | 64.5 |
| 42 | Billings | Montana | 3 | 128 | 65.5 |
| 43 | Omaha | Nebraska | 39 | 94 | 66.5 |
| 44 | Independence | Missouri | 23 | 111 | 67 |
| 44 | High Point | North Carolina | 48 | 86 | 67 |
| 44 | Phoenix | Arizona | 74 | 60 | 67 |
| 47 | Syracuse | New York | 63 | 74 | 68.5 |
| 48 | Columbia | Missouri | 21 | 127 | 74 |
| 48 | Paterson | New Jersey | 69 | 79 | 74 |
| 50 | Denver | Colorado | 67 | 82 | 74.5 |
| 51 | Fairfield | California | 17 | 134 | 75.5 |
| 52 | Palm Bay | Florida | 33 | 123 | 78 |
| 53 | Cincinnati | Ohio | 124 | 36 | 80 |
| 54 | Murfreesboro | Tennessee | 50 | 114 | 82 |
| 55 | Lancaster | California | 103 | 62 | 82.5 |
| 56 | Jersey City | New Jersey | 49 | 120 | 84.5 |
| 57 | Salinas | California | 79 | 95 | 87 |
| 57 | Detroit | Michigan | 172 | 2 | 87 |
| 59 | Houston | Texas | 154 | 21 | 87.5 |
| 60 | Knoxville | Tennessee | 140 | 44 | 92 |
| 61 | El Monte | California | 26 | 159 | 92.5 |
| 62 | Philadelphia | Pennsylvania | 152 | 35 | 93.5 |
| 63 | Salem | Oregon | 25 | 164 | 94.5 |
| 64 | Gresham | Oregon | 11 | 180 | 95.5 |
| 65 | Milwaukee | Wisconsin | 186 | 7 | 96.5 |
| 66 | Aurora | Colorado | 92 | 104 | 98 |
| 67 | Santa Rosa | California | 44 | 153 | 98.5 |
| 68 | Victorville | California | 128 | 76 | 102 |
| 69 | Akron | Ohio | 127 | 78 | 102.5 |
| 69 | Gainesville | Florida | 136 | 69 | 102.5 |
| 71 | Hartford | Connecticut | 187 | 22 | 104.5 |
| 72 | Grand Rapids | Michigan | 142 | 71 | 106.5 |
| 72 | Huntsville | Alabama | 173 | 40 | 106.5 |
| 74 | Rockford | Illinois | 206 | 8 | 107 |
| 75 | Antioch | California | 102 | 113 | 107.5 |
| 76 | Oklahoma City | Oklahoma | 162 | 54 | 108 |
| 77 | Jacksonville | Florida | 118 | 99 | 108.5 |
| 77 | Montgomery | Alabama | 120 | 97 | 108.5 |
| 79 | Hayward | California | 41 | 178 | 109.5 |
| 79 | Santa Ana | California | 90 | 129 | 109.5 |
| 81 | San Jose | California | 66 | 154 | 110 |
| 82 | Vallejo | California | 174 | 48 | 111 |
| 83 | Pomona | California | 116 | 109 | 112.5 |
| 84 | Newport News | Virginia | 100 | 126 | 113 |
| 85 | Manchester | New Hampshire | 144 | 85 | 114.5 |
| 86 | Fort Worth | Texas | 122 | 108 | 115 |
| 87 | Boston | Massachusetts | 143 | 88 | 115.5 |
| 88 | New York | New York | 117 | 115 | 116 |
| 89 | Moreno Valley | California | 77 | 161 | 119 |
| 90 | Norwalk | California | 88 | 151 | 119.5 |
| 91 | Visalia | California | 61 | 179 | 120 |
| 92 | Dallas | Texas | 184 | 57 | 120.5 |
| 93 | Santa Clara | California | 6 | 239 | 122.5 |
| 93 | Corpus Christi | Texas | 170 | 75 | 122.5 |
| 95 | Concord | California | 71 | 175 | 123 |
| 96 | San Bernardino | California | 233 | 14 | 123.5 |
| 97 | Allentown | Pennsylvania | 110 | 138 | 124 |
| 97 | Waco | Texas | 126 | 122 | 124 |
| 99 | Ventura | California | 104 | 147 | 125.5 |
| 99 | Indianapolis | Indiana | 239 | 12 | 125.5 |
| 101 | Palmdale | California | 112 | 143 | 127.5 |
| 101 | Fresno | California | 149 | 106 | 127.5 |
Methodology
Crime data analysis
Law enforcement agencies from cities, metropolitan areas, counties, universities, state, tribal and other agencies across the country submit crime data to the FBI using their Uniform Crime Reporting system. The data is made available for the public to view, download and analyze.
This is a two-part study. In the first part, we analyzed data as reported by agencies from cities – mostly police departments from cities. In the second part of the study, we analyze data submitted by the university and campus police departments of universities and colleges across the country.
We used FBI’s Uniform Crime Reporting tool to collect data for the year 2017. Overall, data from 8,793 law enforcement agencies that represented more 193 million of the US population helped us draw interesting insights between the size of the police force and the incidence of crime. See Table 1 for a summary of coverage.
Crime data coverage
There are two broad classifications of crimes: violent crimes and non-violent crimes. According to the FBI website, “Violent crime is composed of four offenses: murder and nonnegligent manslaughter, rape, robbery, and aggravated assault. Violent crimes are defined in the UCR Program as those offenses that involve force or threat of force. Property crime includes the offenses of burglary, larceny-theft, motor vehicle theft, and arson. The object of the theft-type offenses is the taking of money or property, but there is no force or threat of force against the victims. ”
The set of rankings uses a larger weight to Violent crime than Property crime. We assigned twice the weight to Violent crime than Property crime. Then we transformed the Total crime rate variable using x’ = log(x+1) so that the skewness is reduced. Then we normalized it using x’/max(x’) transforming the final number to a score between 0 and 1.
We computed a new variable called Police Adequacy = TotalCrimes / Number of police employees. We consider that smaller Police adequacy statistic is, safer the city is. We transformed and normalized Police adequacy also, resulting in a crime score between 0 and 1. Next, we combined the two scores to create a score for each city.
Staying safe in a dangerous city
If you’re stuck in one of the most dangerous cities, there are a few ways you can still keep yourself safer then most. Consider installing an alarm system in your home. Some of the best systems include ones by ADT, FrontPoint and Vivint. If you don’t want a complex installation, there are a number of wireless systems as well . (See our review of simplisafe for a good no install system). Alternatively you can put up a home security camera. Many of them work directly with your phone to alert you when there is movement. Finally, if you have elderly family who don’t have a caretaker, they should probably check out our best medical alert system page.